All Courses
Data Science
beginner
Data Analytics with Python: From Spreadsheet to Dashboard
4.8
11,255 students
4h 15m
17 lessons
About this course
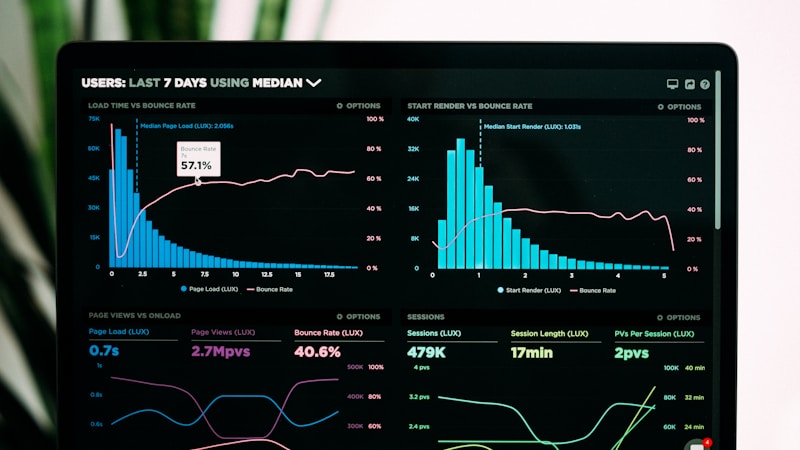
Transform raw data into actionable insights. This course takes you from Excel basics through Python data analysis with pandas, visualization with matplotlib and seaborn, and building interactive dashboards with Plotly. You will analyze real datasets from business, healthcare, and finance, and learn the statistical thinking behind every chart.
Course Content
Data Thinking and Tools Setup
- Why Data Analytics Matters: Real-World Impact15min
- Reading Data: CSV, Excel, JSON, and Databases15min
- DataFrames: Selecting, Filtering, and Sorting15min
- Setting Up Python, Jupyter, and pandas15min
Data Cleaning and Transformation
- Data Types, String Operations, and Date Parsing15min
- Project: Cleaning a Messy Sales Dataset15min
- Merging and Joining Multiple Datasets15min
- Handling Missing Values and Duplicates15min
- Grouping, Aggregation, and Pivot Tables15min
Statistics for Analysts
- Correlation, Regression, and Causation15min
- Hypothesis Testing and P-Values Explained15min
- A/B Testing: Design and Analysis15min
- Descriptive Statistics and Distribution Shapes15min
Data Visualization
- Principles of Effective Data Visualization15min
- matplotlib and seaborn for Static Charts15min
- Project: Building a Business Intelligence Dashboard15min
- Interactive Dashboards with Plotly and Dash15min
Free — no credit card required
This course includes:
- AI-generated interactive lessons
- Interactive quizzes and exercises
- Real-time AI teacher discussions
- Whiteboard diagrams and formulas